Venture Capital Valuation Methods
The methods behind valuations used in venture capital are a breed unlike the operational valuations we’ve discussed in our prior posts. For startups, particularly those in the earliest stages, financial metrics are often not applicable, as companies’ have fairly limited financials, if any. This post covers three of the most common valuation methods used in VC:
- Venture Capital Method
- Payne Scorecard
- Berkus Method
Venture Capital Method
We’ll start with the far too generically named Venture Capital Method (or VC Method). This method was developed in the late 1980s by Bill Sahlman at Harvard Business School. The steps to calculate a pre-money valuation using this method are as follows:
Step 1: What is the company’s anticipated exit value in the future?
This step requires the use of market comps or financial metrics. If someone has a crystal ball and knows with certainty what a company will be worth years down the road, they’re going to make a lot of money. For the rest of us, this requires some judgment calls. If the company has current revenue, applying an industry multiple may be an appropriate way to arrive at a future value. Unfortunately, this can be a wildly volatile metric – we’ve seen revenue multiples for SaaS companies drop from the peak of 30x in late 2021 to just a third of that in mid-2022. Other comps might include recent transactions of similar companies, although this still introduces a time-based issue, as the sale of a company in today’s landscape could be much different from a sale 5-10 years down the road.
Step 2: What return on this investment does the investor require?
Different investors have different risk tolerances and alternative investment options, so each investor may have a different return on investment (ROI) hurdle. Accordingly, the valuation using the VC method may not be comparable between investors.
Step 3: Post-money valuation = Exit value / Required ROI
Let’s assume that the investor anticipates an exit of $48M. If the investor requires a ROI of 30, we can calculate the post money valuation as:
$48,000,000/30 = $1,600,000.
Step 4: Pre-money valuation = Post-money valuation – investment
If we assume that the company is raising $500,000, we can calculate the pre-money valuation as:
$1,600,000 – $500,000 = $1,100,000.
What about dilution?
The calculations above assume that there is only a single round of funding. While this is theoretically possible, it’s not often the case. Trying to guess how much dilution will occur in the future is another bit of fortune-telling, but a seasoned investor who has seen the progression of investments over time may be able to come up with a fairly accurate estimate. If we continue with our example, assuming that dilution in the future will be 30%, we can calculate the diluted pre-money investment as follows:
$1,100,000 x (1- 30%) = $770,000.
Payne Scorecard
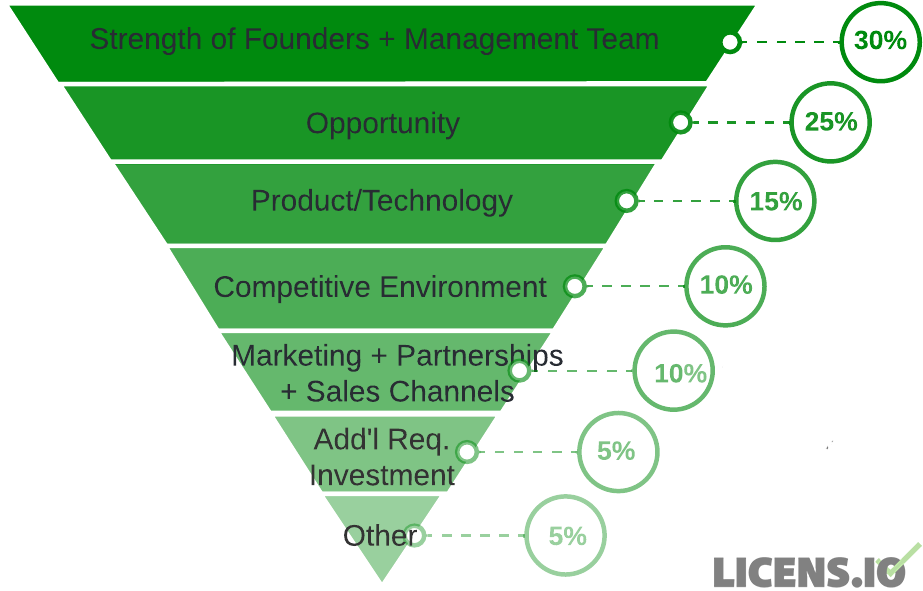
The Payne Scorecard method uses what the investor believes to be an “average” company as the standard against which to compare the target company. The Payne Scorecard contains 7 categories, with each given a certain weight in the overall calculation. While the specific weights can be tailored to more heavily weight areas that are more important to the investor, the chart below shows the general ranking of the factors, as well as the traditional weights.

Factors
What kind of considerations are included in each of the factors? Some questions that an investor might ask for each category could include:
- Strength of founders + management team:
- Have the founders successfully founded other companies?
- Is the executive team complete?
- Opportunity:
- How large is the total addressable market (TAM)?
- Is there a first-mover advantage?
- Product/technology:
- Is there a prototype or minimum viable product (MVP)?
- Are there intellectual property protections in place (e.g., patents)?
- Competitive environment:
- Are there many competitors in the market?
- Are the competitors offering a strong product or service?
- Are there regulatory hurdles that would hinder competitors’ entry into the market?
- Marketing + partnerships + sales channels:
- Are there existing business partnerships?
- Have all possible sales channels been explored?
- Are there signed sales contracts?
- Additional investment required:
- Will future capital raises be required, or will this raise be sufficient to achieve goals?
- Other:
- Is there strong customer support (such as “super fans”)?
- Does the company have beneficial supplier relationships?
Benchmark
Each category uses the investor’s theoretical “average” company as the benchmark – a score of 100% would mean that the target company is comparable with average; a score below 100% is below average (that is, it’s a weakness of the target company) and a score above 100% is above average (that is, it’s a strength or advantage for the target company).
Let’s look at an example to see this in action.
An investor gives Company A the following scores based on how it compares to the other companies in the investor’s portfolio:
- Strength of founders + management team: 200% – the investor has had multiple successful exits with the founders
- Opportunity: 100% – the total addressable market is large, but there are numerous competitors
- Product/technology: 125% – Company A has already developed the platform and has paying customers
- Competitive environment: 95% – there are numerous competitors, including two that have significant market share, but customers don’t seem hugely loyal to the competitors.
- Marketing + partnerships + sales channels: 110% – Company A has numerous sales contracts and has begun to discuss partnerships with complementary companies
- Additional investment required: 75% – Company A will likely need multiple rounds of funding; while they are generating revenue, R&D costs are expected to be significant
- Other: 120% – Company A has gotten glowing reviews from customers, including public testimonials
Weighted Calculation
A weighted factor is then calculated for each category for the target company. The investor’s weight for a given category is applied to arrive at a weighted percentage for that specific factor. Once each factor has been calculated, the sum of the 7 categories is the target company’s total score. Similar to the category-specific benchmarks, a weighted score of 1.00 is average; a score above 1.00 means that the target company is above average, and the valuation will be greater than the “average” company valuation.
If we continue our example with Company A, the weighted scorecard would look like this:
| Factor | Weighting | Comparison (Target vs. “Average”) | Weighted Factor |
|---|---|---|---|
| Strength of founders + management team | 30% | 200% | 0.60 |
| Opportunity | 25% | 100% | 0.25 |
| Product/technology | 15% | 125% | 0.1875 |
| Competitive environment | 10% | 95% | 0.095 |
| Marketing/Sales/Partnerships | 10% | 110% | 0.11 |
| Additional investment required | 5% | 75% | 0.0375 |
| Other | 5% | 120% | 0.06 |
| Total | 100% | 1.34 |
Benchmark Valuation
Once a weighted score has been calculated, it can be multiplied by the valuation of the “average” benchmark. But wait! Where does the benchmark valuation come from? It may be from recent raises or acquisitions from similar companies, either within the investor’s portfolio or more broadly. It may be a mathematical average of numerous companies, or a single valuation of a company that the investor believes to be comparable.
For Company A, the benchmark pre-money valuation is $5,000,000. To calculate the valuation for Company A, we multiply this by the weighted score of 1.34, arriving at a pre-money valuation of $6,700,000.
Berkus Method
This method is used for pre-revenue companies, as the valuation is based on risk factors associated with the company’s stage of development and qualitative considerations, rather than financial metrics. The Berkus Method was first developed to evaluate technology companies, but it’s now used to assess companies across a broad range of industries.
Milestones
The Berkus Method considers five benchmarks or milestones; each benchmark that is met by a company can contribute up to $500,000 towards their valuation, for a maximum valuation of $2,500,000. The benchmarks are:
- Sound Idea
- Prototype
- Quality Management Team
- Strategic Relationships
- Product Rollout or Sales
The Berkus Method is used to value companies that the investor believes can achieve annual revenue of $20 million (this was Dave Berkus’ target number, so it could vary when used by a different investor) within the next five years. Investors can adjust the maximum valuation per bucket as they feel is appropriate, likely influenced by industry, geographic location, or general market trends – as we’ve said again and again, early stage valuations are an exercise in subjectivity and judgment calls. The Berkus Method, however, emphasizes that early valuations should remain low enough for those investors who take on the significant risk associated with early stage investments – hence the $2,500,000 maximum valuation possible under this method using Dave Berkus’ caps.
Company Assessment
The target company is assigned a percentage out of 100% in each of the buckets based on its current achievement of the milestone or benchmark. The maximum value per bucket ($500,000) is then separately multiplied by the applicable percentage; the resulting calculations are added together to form the company’s total pre-money valuation. Given that this method is used for very early stage companies, it’s not unusual for companies to have 0% for one or more milestones (e.g., product rollout or sales since).
Let’s illustrate this through an example in which an investor assesses Company B’s current achievement of the milestones as follows:
- Sound idea: Company B has identified a clear need in the market, but they have not achieved product-market fit yet – 90%.
- Prototype: Company B has a working prototype and has worked out all of the bugs for the initial release – 100%.
- Quality management team: The founders and C-suite team all have prior experience in successful startups and have sufficient expertise in Company B’s industry – 100%.
- Strategic relationship: Company B has outlined their goals for development of strategic relationships, including identifying relevant parties, but they have not begun discussions with most of the parties – 10%.
- Product rollout or sales: Company B has begun beta testing their product, but they have not released it publicly – 10%.
Target Company: Company B
| Maximum Valuation | Company B | Company B Valuation | |
|---|---|---|---|
| Sound Idea | $500,000 | 90% | $450,000 |
| Prototype | $500,000 | 100% | $500,000 |
| Quality Management Team | $500,000 | 100% | $500,000 |
| Strategic Relationships | $500,000 | 10% | $50,000 |
| Product Rollout or Sales | $500,000 | 10% | $50,000 |
| Total | $2,500,000 | $1,550,000 |
What Method Should You Use?
In short: whichever method you prefer. We’re not being cheeky here; the decision of which of the above methods (or any of the other numerous ones!) to use is based largely on what the investor values most. If they’re trying to quickly determine whether a target will be worth their time (i.e., will meet or exceed the investor’s opportunity cost), the VC Method may be their go-to. If the investor is picking one investment out of a group of similar targets, the Payne Scorecard might best allow them to compare the companies and invest in the one with the highest composite score.
Investors’ risk tolerance, investment timeframe, size of investment, and overall portfolio all influence which method of valuation they use. Seasoned investors generally develop a sense for what “matters” in an investment, and create (either methodically or more intuitively) their own method of valuing potential investments.


